


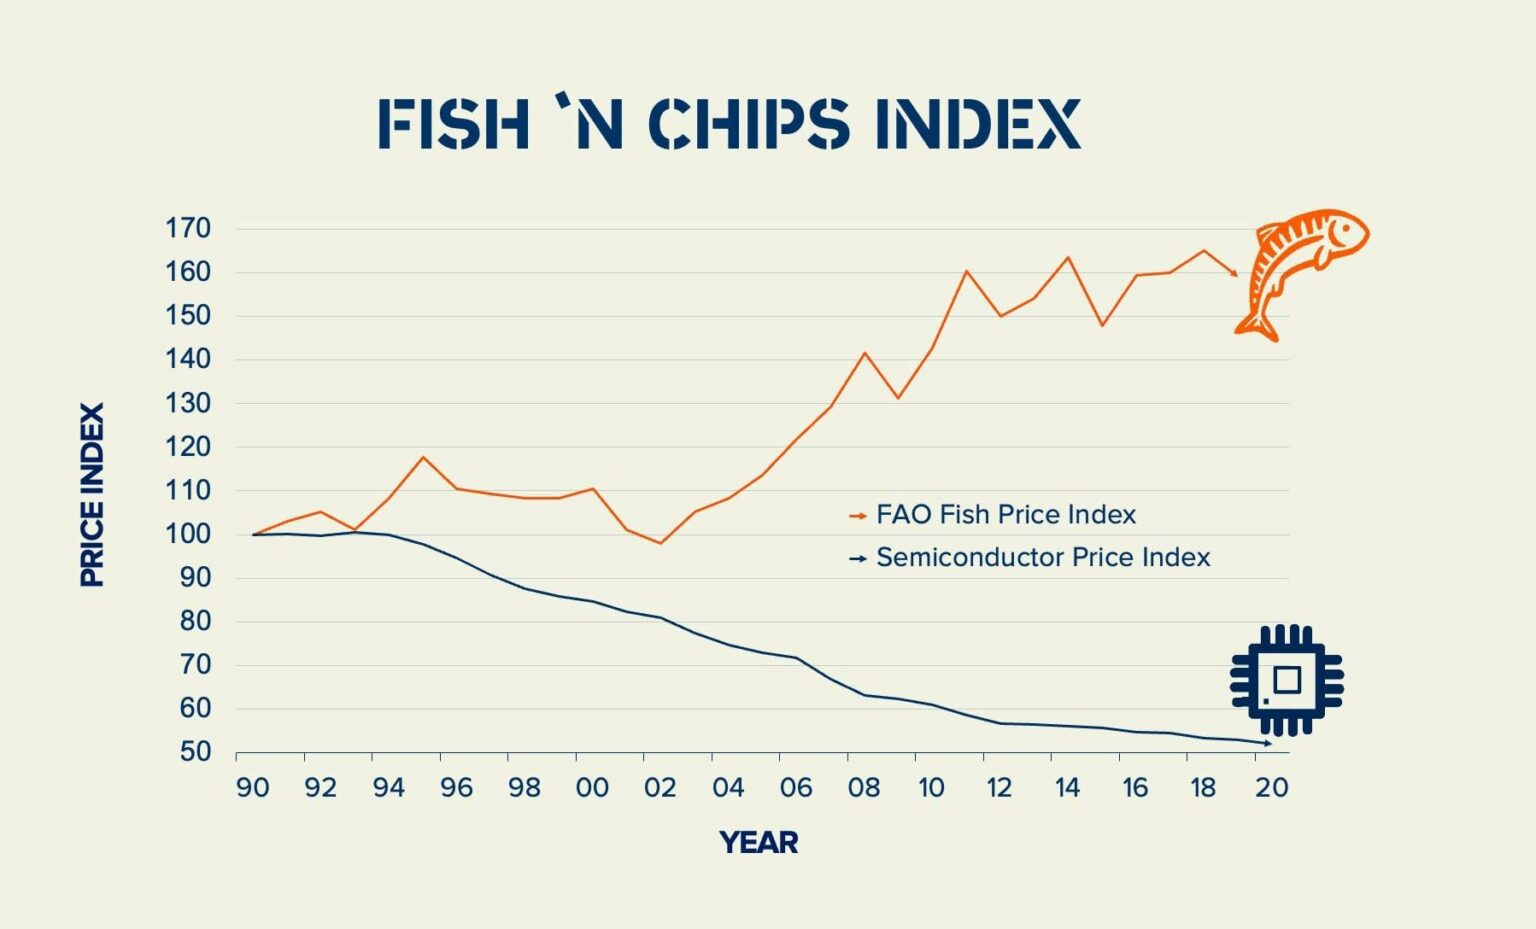
There is one mega-trend that is driving the digital transformation of the seafood sector more than anything else. I call it the fish n’ chips index: since 1990, the relative price of fish, according to the FAO Fish Price Index, has increased by 60 percent while the relative price of semiconductors, or “chips”, has decreased by 45 percent. It’s more feasible than ever to use technology to track raw material in seafood processing.
In fact, raw material can cost up to 75 percent of the total cost of production, higher than any other input. That’s why seafood processors fanatically monitor their yields or recovery rates, the percentage of raw material that ends up in the final product. Waste can significantly impact their bottom line.
The Japanese production method known as “lean manufacturing” is obsessed with eliminating seven types of waste or muda (無駄). Toyota pioneered this method which has now been widely adapted in many industries. So, let’s see how leaning manufacturing applies to seafood processing.
Planning
Poor production planning can lock-in waste even before a single fish is cut. How? First, raw material can be mismatched to final product specifications. If you don’t meet a customer’s minimum requirements, a costly return could occur. On the other hand, exceeding a customer’s requirements can be wasteful as well. An example is using premium grade fish in a burger when a secondary grade would do. You’re essentially wasting expensive raw material on a low-priced product.
A simple mistake, such as accidentally writing the wrong lot code, can also be incredibly costly. Indeed, if a mistake isn’t caught early on, the cost grows exponentially at every stage of production. Imagine if the wrong raw material is accidentally specified in planning and the product is produced and shipped, only to be returned by a dissatisfied customer. The cost is exponentially higher than if the error was caught and corrected when the fish was picked from cold storage or even in production.
A third planning challenge is accurately predicting how much raw material is needed to fill an order. Processors need to maintain updated yield estimates, which can be challenging given the number of variables that can impact recovery rates such as fish size, cold storage duration, quality, product type, and so on. Inaccurate yield estimates results in overproduction or underproduction.
Production
Uneven and overburdened production processes cause waste. The Japanese call this mura (unevenness) and mira (overburden). Rushed workers make mistakes which cause quality issues.
For example, filleters may have lower yields as they speed up fish cutting. A stressed supervisor may accidentally overcook tuna in a cannery, causing yields to collapse. Higher variances on portion control impact yields too. Bottlenecks can cause delays and downgrading of product. Incorrect labelling—from best before dates and lot codes to nutrition tables—can trigger customer returns or even recalls. All these problems drive up material costs.
Even when everything goes right in production, things can still go wrong in shipping. I talked to one Alaskan processor that discovered that their workers were accidentally overstuffing shippingcontainers by 10 percent, resulting in a $US 500,000 loss to the company each year. Accidentally putting one wrong pallet into a shipping container can create compliance problems at borders, resulting in delays or even rejections by Customs officials.
Quality Control
Quality control (QC) is typically used to catch costly mistakes and noncompliance. However, quality control itself can be subject to errors since a lot of data is copied from paper forms and mistakes can happen with manual calculations. QC reports are often compiled at the end of the day, which means poor performance isn’t always flagged in real-time. It’s only when things are very bad that corrective actions are triggered.
Automation and Visualization
So how can software help? In Japanese lean manufacturing, there are two methods for preventing or catching mistakes: automation (jidoka) and visualization (andon). Digitization can play a key role here.
First, let’s look at automation. Software can automate data collection, sharing and reporting, reducing the risk of errors. In a paper-based system, data is often copied from one form to the next in the production process. That data is then copied into Excel spreadsheets for reporting or into ERP systems. Software enables data to automatically flow from user to user, and integrations with other software can automate data sharing and reporting.
Yet not everything can be automated, which is where andon or a visual feedback system comes into play. With software, data can be displayed in real-time dashboards, in reports and on users’ screens. The word andon (行灯) actually means paper lantern in Japanese, signifying a visual alert when problems arise. For example, software can be programmed to issue a visual alert when a temperature falls outside a maximum and minimum range. Incomplete or duplicate data entries could trigger a pop-up warning on a screen.
The Japanese call this poka-yoke (ポカヨケ) meaning “mistake-proofing” or literally – avoiding(yokeru) inadvertent errors (poka). When errors or non-compliance does occur, they are immediately visualized for the operator, but also for everyone else using the software. If one person doesn’t catch a mistaken, then another one will. And the sooner a mistake is caught and corrected, the less expensive it will be.
Because of the natural viability of fish, it can be difficult for seafood processors to predict quality and production outcomes, such as yield. That’s where artificial intelligence (AI) may unlock significant value for seafood processors in the future. Machine learning is a type of AI whereby software learns from past experience to predict the future. At ThisFish, we’ve already created a yield prediction model for a Thai tuna cannery that can accurately predict what yields should be. It allows managers to better monitor their performance, ensuring they are doing everything they can to maximize profitability.
According to the report Traceable Returns by Planet Tracker, seafood processors average only 3.4 percent earnings margin before interest and tax. Planet Tracker estimates that profit margins could double with increased investments in traceability technology. While traceability is often promoted by NGOs to prove food provenance, it is also key to managing material costs which, in turn, is key to improving profitability.
